

Brand & product monitoring
Any brand.
Any product.
Worldwide.
See where your brand and competing products appear across selected releases and markets worldwide. Compare screen time and placement context, then use source frames and timestamps to review product placements and support media planning.
Worldwide streaming coverage
From global premieres to local releases.
Combine worldwide streaming access with AI recognition to monitor any brand or product in any release. Follow international premieres, local originals and catalogue titles across markets. Explore a single production or build a consistent view of brand presence across platforms, releases and reporting periods.
Use case · Competitor monitoring
Your brand and every competing brand.
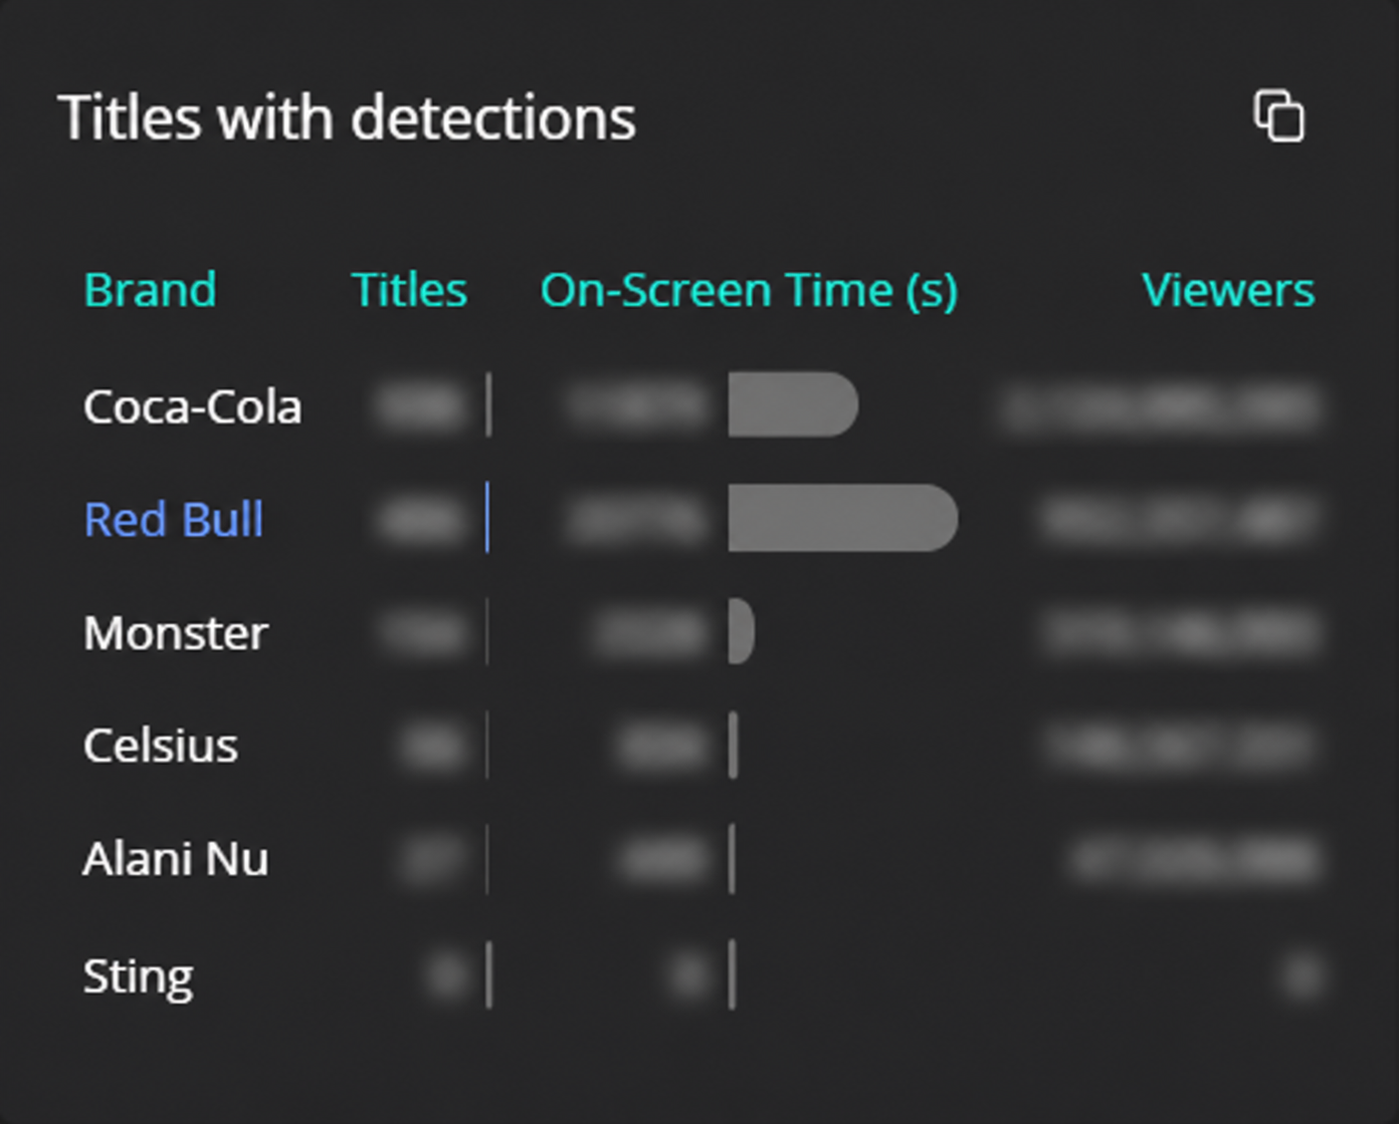
Monitor your own brand and all competing brands in your category across the same releases, streaming platforms, markets and reporting periods. Compare appearances, screen time and placement context, and see each brand’s share of measured visibility. Track how exposure changes over time and identify the titles and scenes driving those differences.
- Compare brands within the same release.
- Measure category-wide visibility across platforms and markets.
- Track exposure across comparable reporting periods.
Product-placement reporting
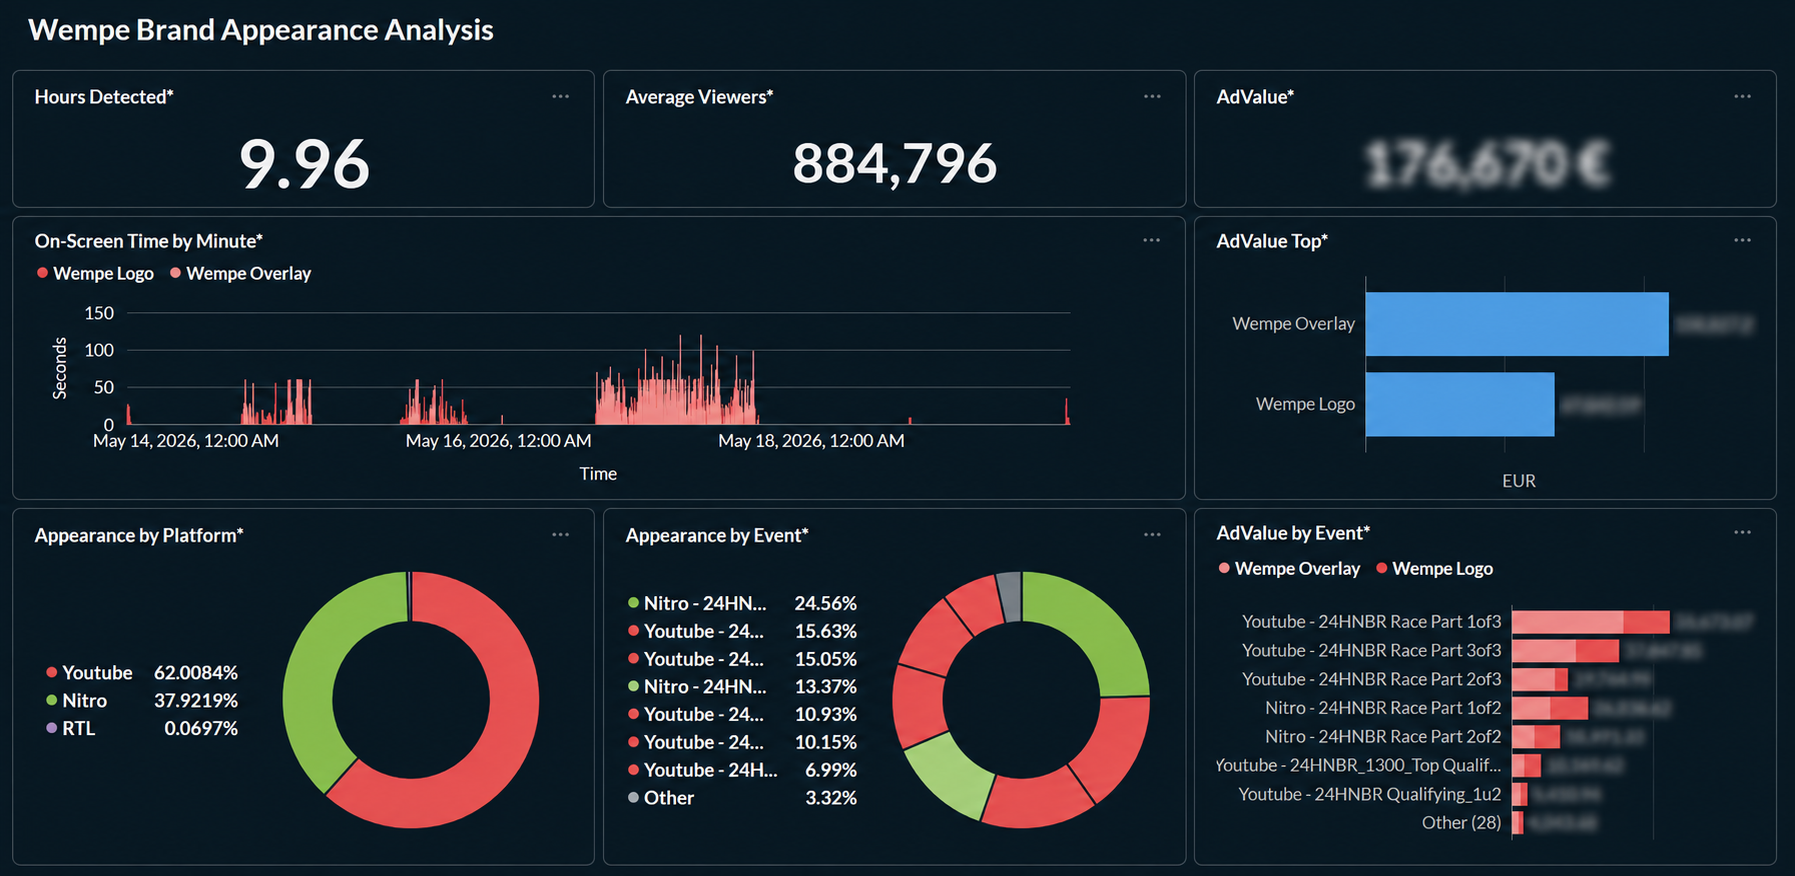
Evidence your team can work with.
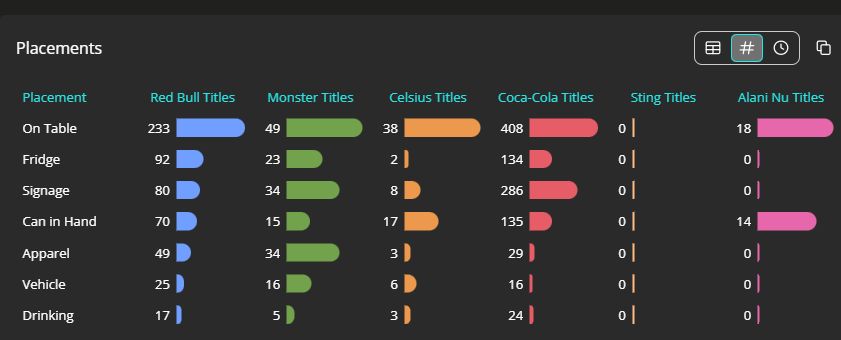
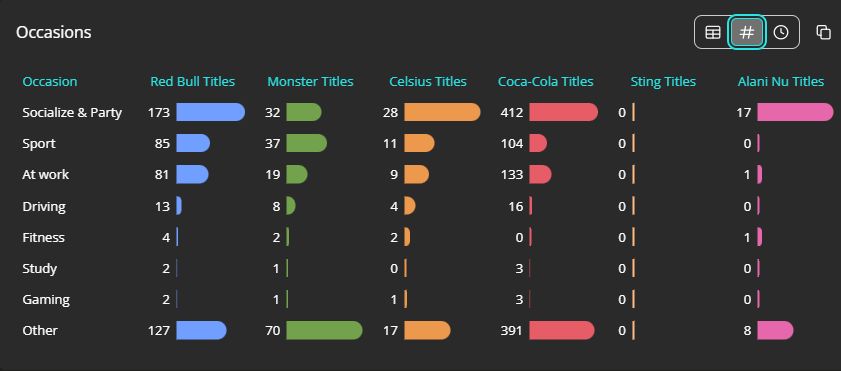
Bring the findings into dashboards and reports your team can use. Review detections with their source frames and timestamps, compare titles and reporting periods, and share a clear record of brand presence with marketing teams, agencies and partners.
Product detection in context
Real scenes. Recognised products.
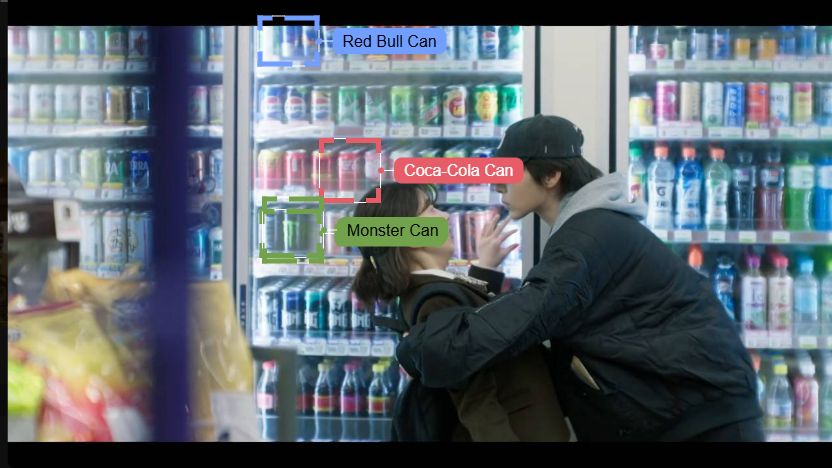
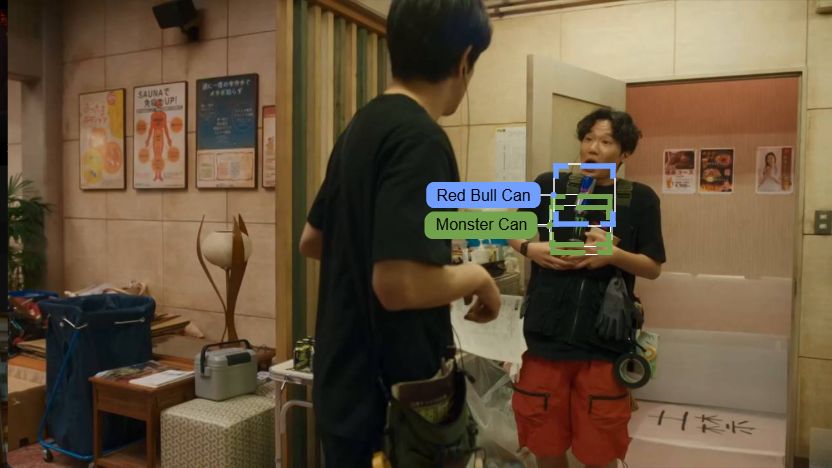
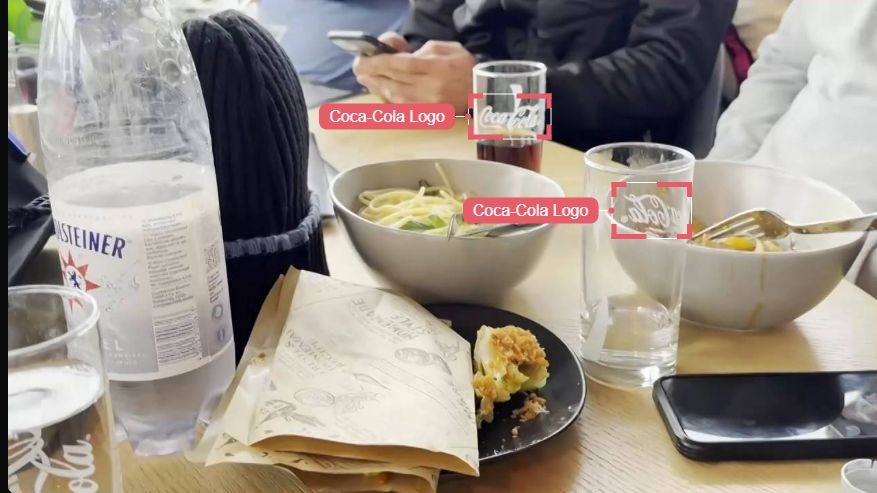
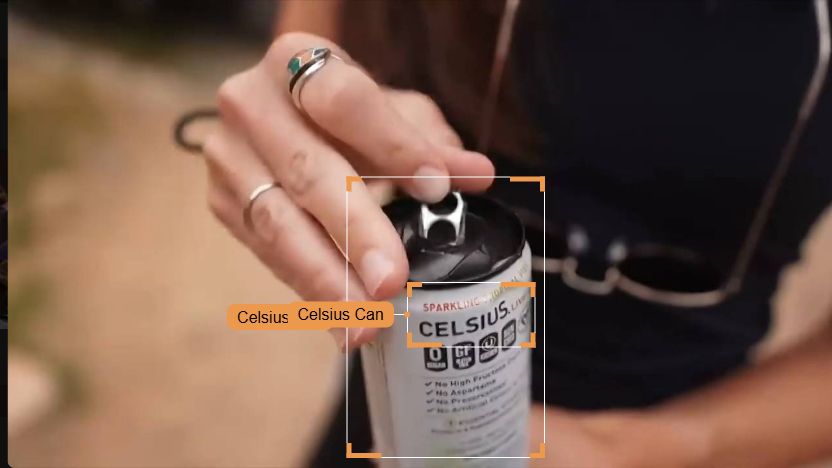
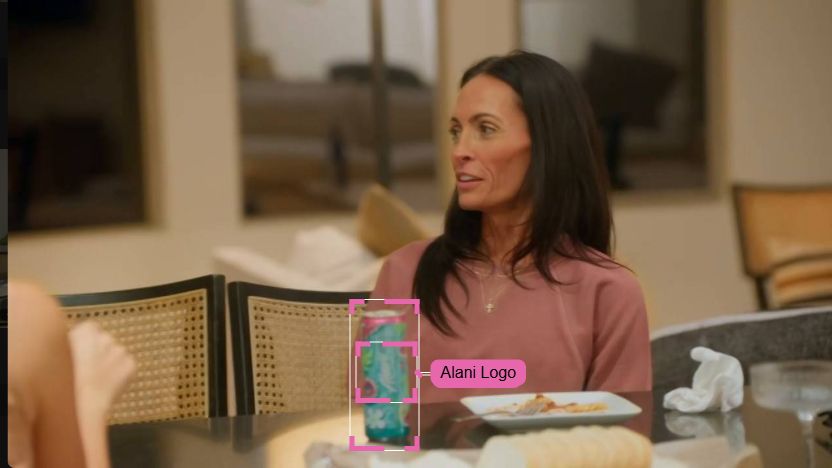
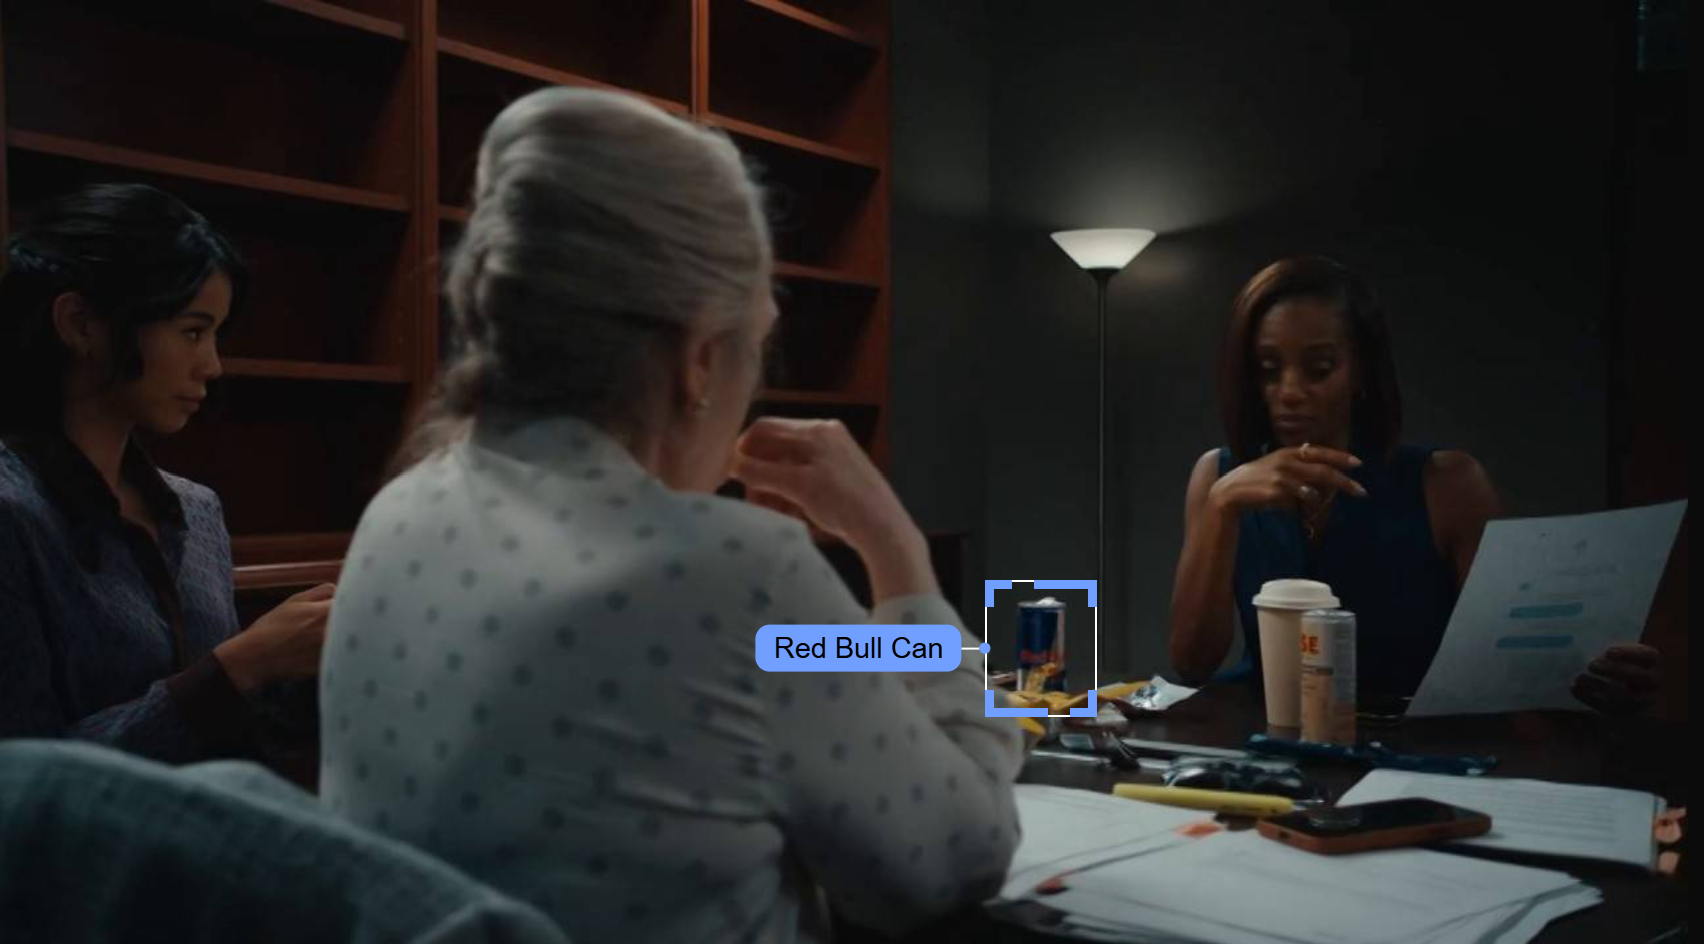
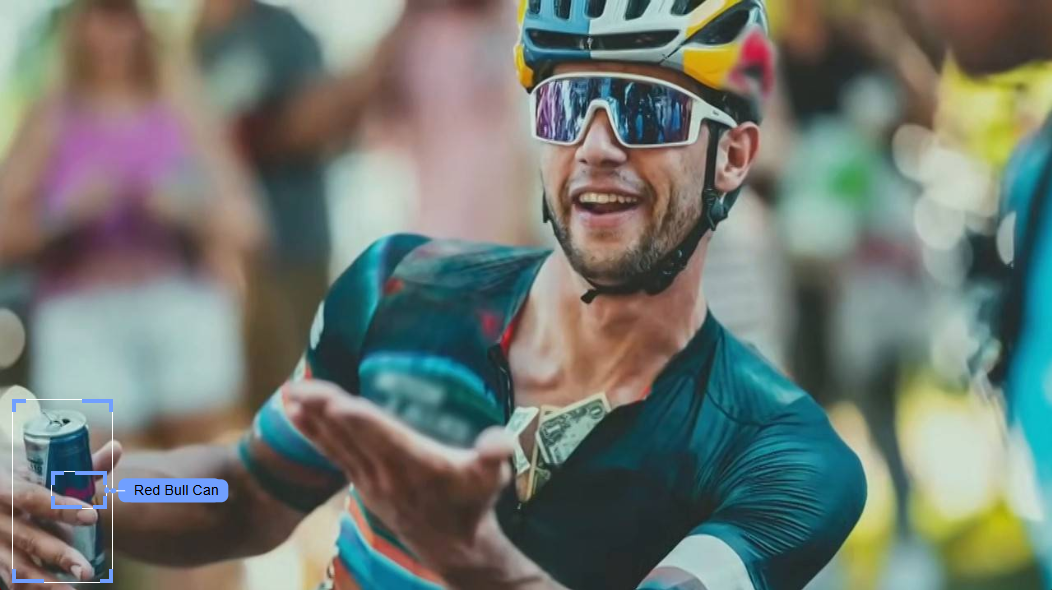
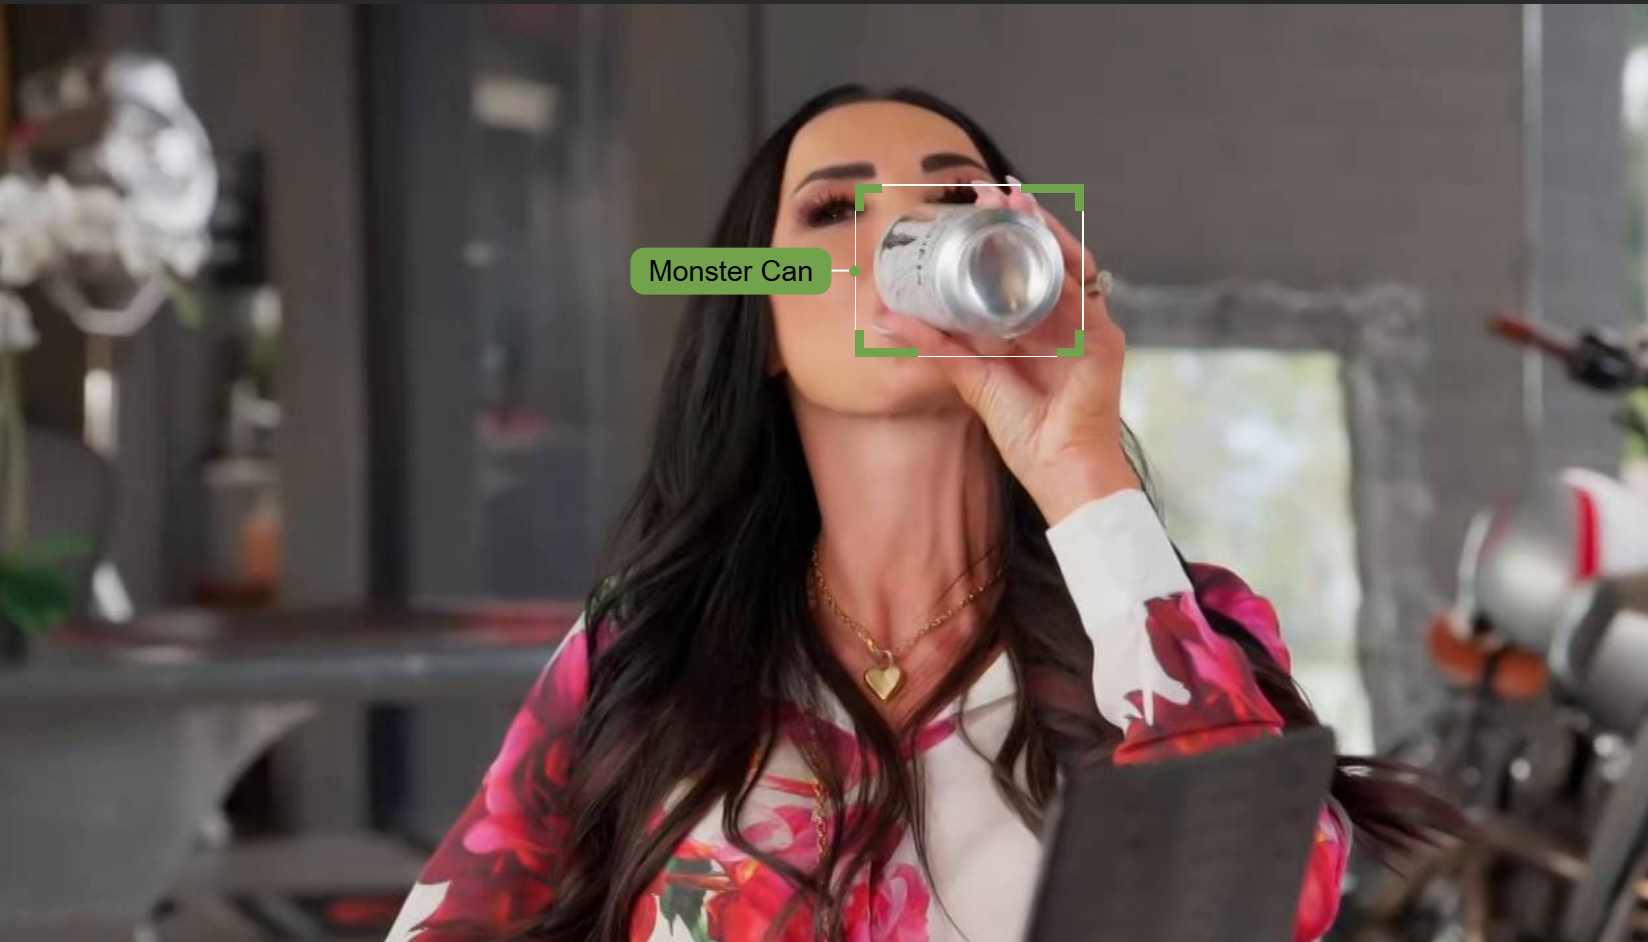
Explore product and logo detections across scenes: products held in hand, placed on a table or displayed in the background. Select a thumbnail, then open the image to inspect the complete frame and its annotations.


What the solution reveals
Measure visibility. Understand the context.
Brands, products and logos
Recognise logos, branded packaging and products in the foreground or background of video content.
Frequency and screen time
Compare the number of appearances and their on-screen duration across the same content and reporting periods.
Placement and context
Separate a product being held or used from one placed in the background. Review the surrounding scene to understand how the brand is presented.
Spoken brand mentions
Find spoken brand names and keywords alongside visual brand and product appearances.
Releases and markets
Follow brand presence across films, series, streaming platforms and markets worldwide.
Competitive comparisons
Track all competing brands alongside your own using a consistent set of exposure measures.
A clear process
From release to report.
Collect
Bring together releases from streaming services worldwide.
Detect
Identify the brands, products and logos you want to follow.
Validate
Review detections and add placement and contextual information.
Report
Share clear dashboards and reports that connect comparable exposure measures with source frames and timestamps.
Review with source evidence.
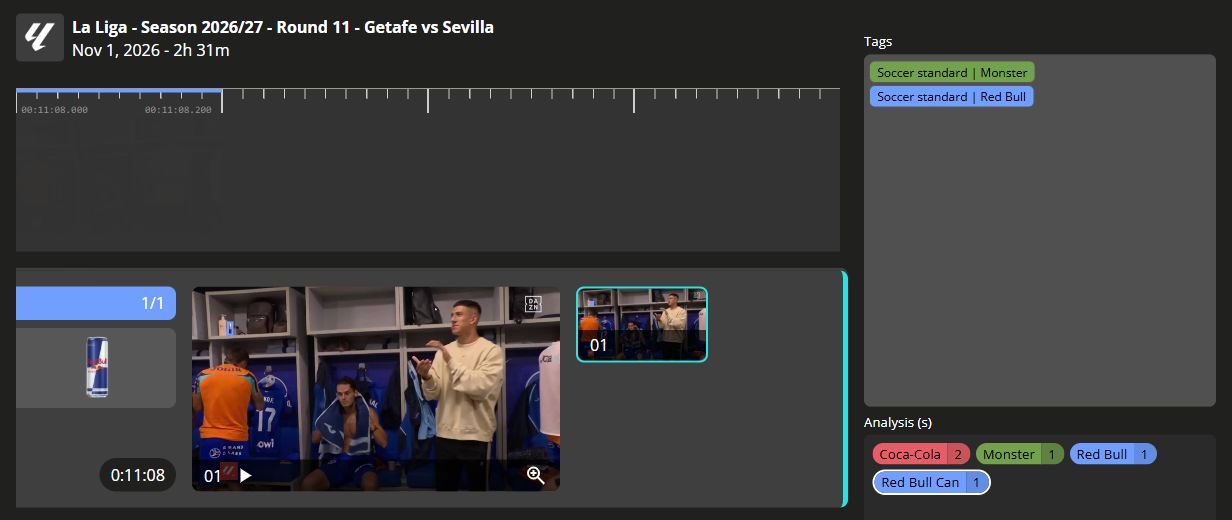
A review workspace brings the source frame, timeline and analysis tags together. The extent and depth of review follow the agreed service level.
Start your worldwide brand monitoring.
Tell us which brands, products and competing brands you want to track. We will shape the monitoring and reporting around your goals.