A management-ready overview
Understand the measurement scope, the key findings and the placements contributing to your brand's exposure.
 ×
 ×
Panaccess Analytics
Know where your brand appears. Understand the context. Turn selected TV, streaming and video content into evidence for sponsorship, campaign and media decisions.
Brand visibility • Sponsorship measurement • Advertising monitoring
Clear results. Verifiable evidence.
Bring the headline findings and the supporting evidence into one conversation. Agree the deliverables at the start, then review results in the format your team needs.
Measure brand visibility, compare competing brands and review sponsorship and advertising exposure. Turn selected TV, streaming and digital content into evidence for media planning and partner conversations.
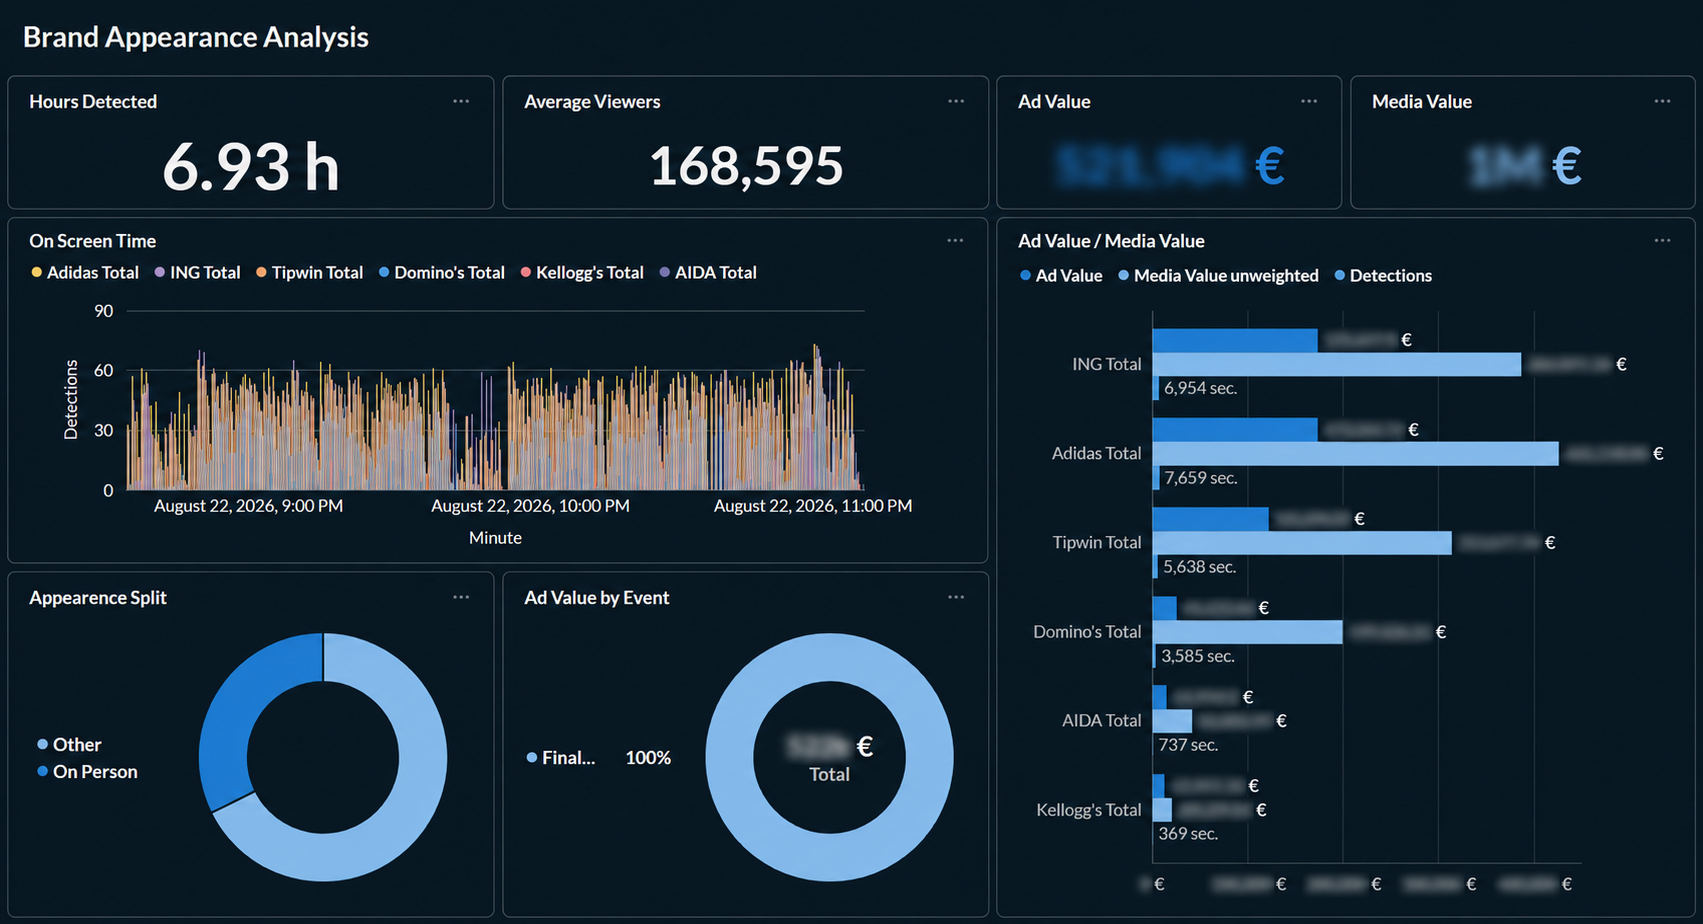
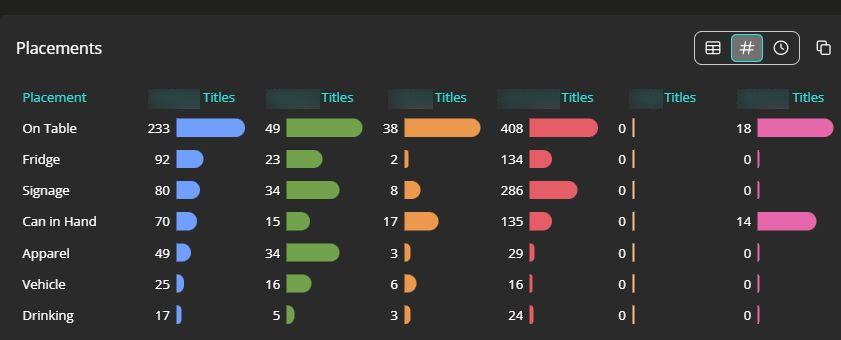
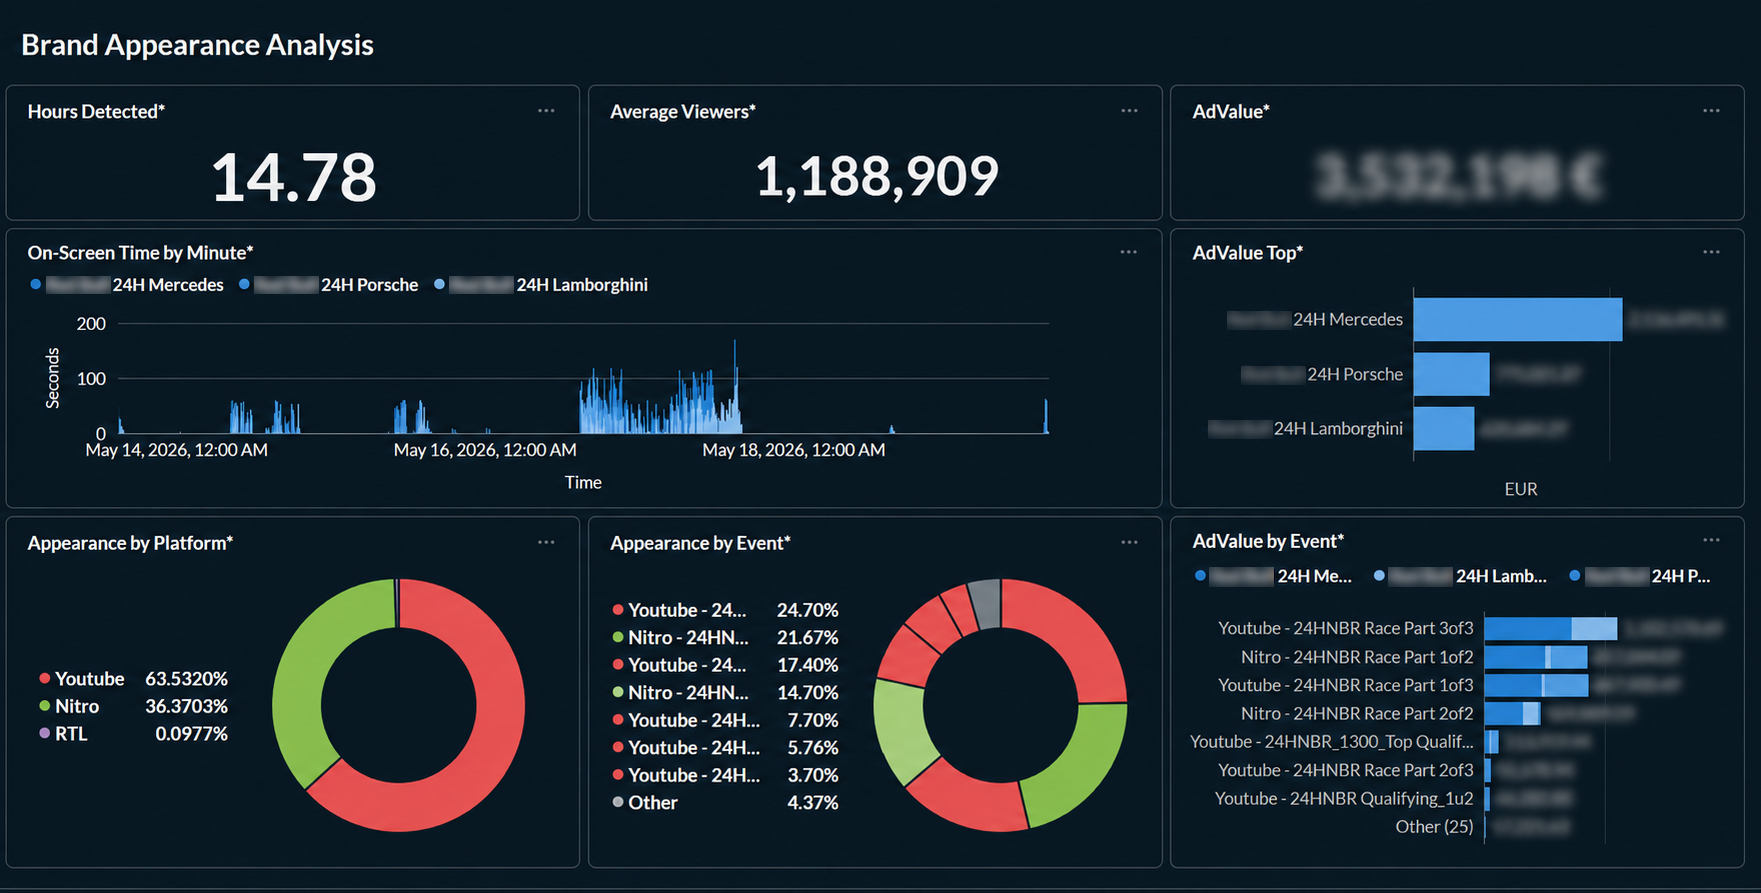
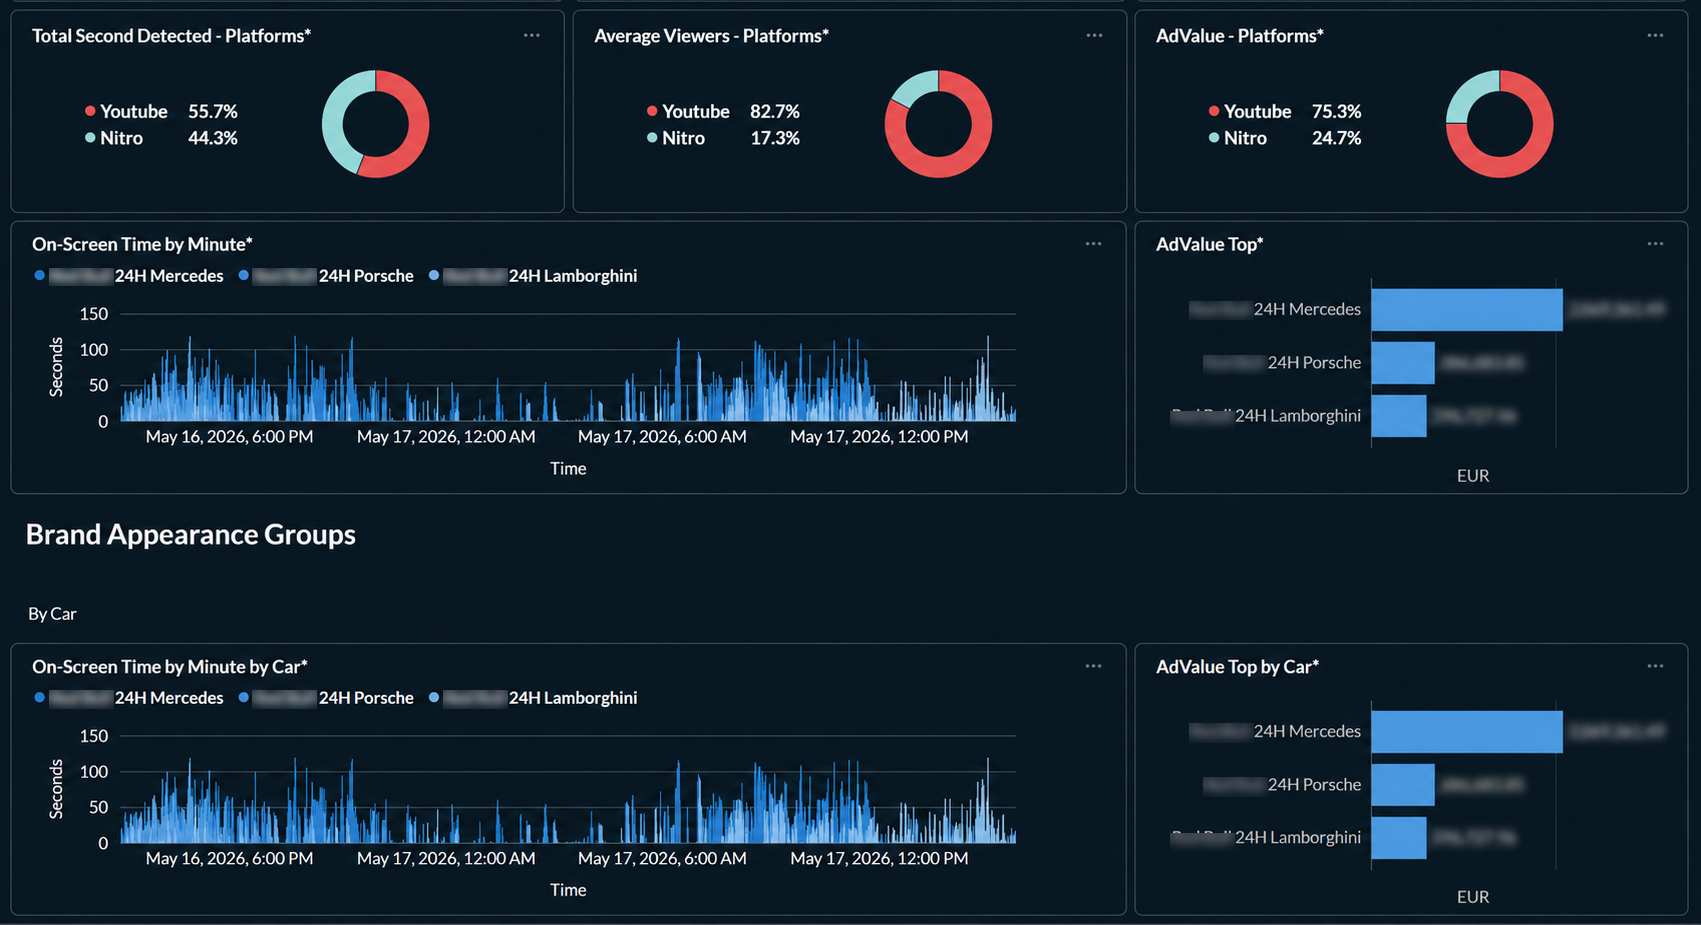
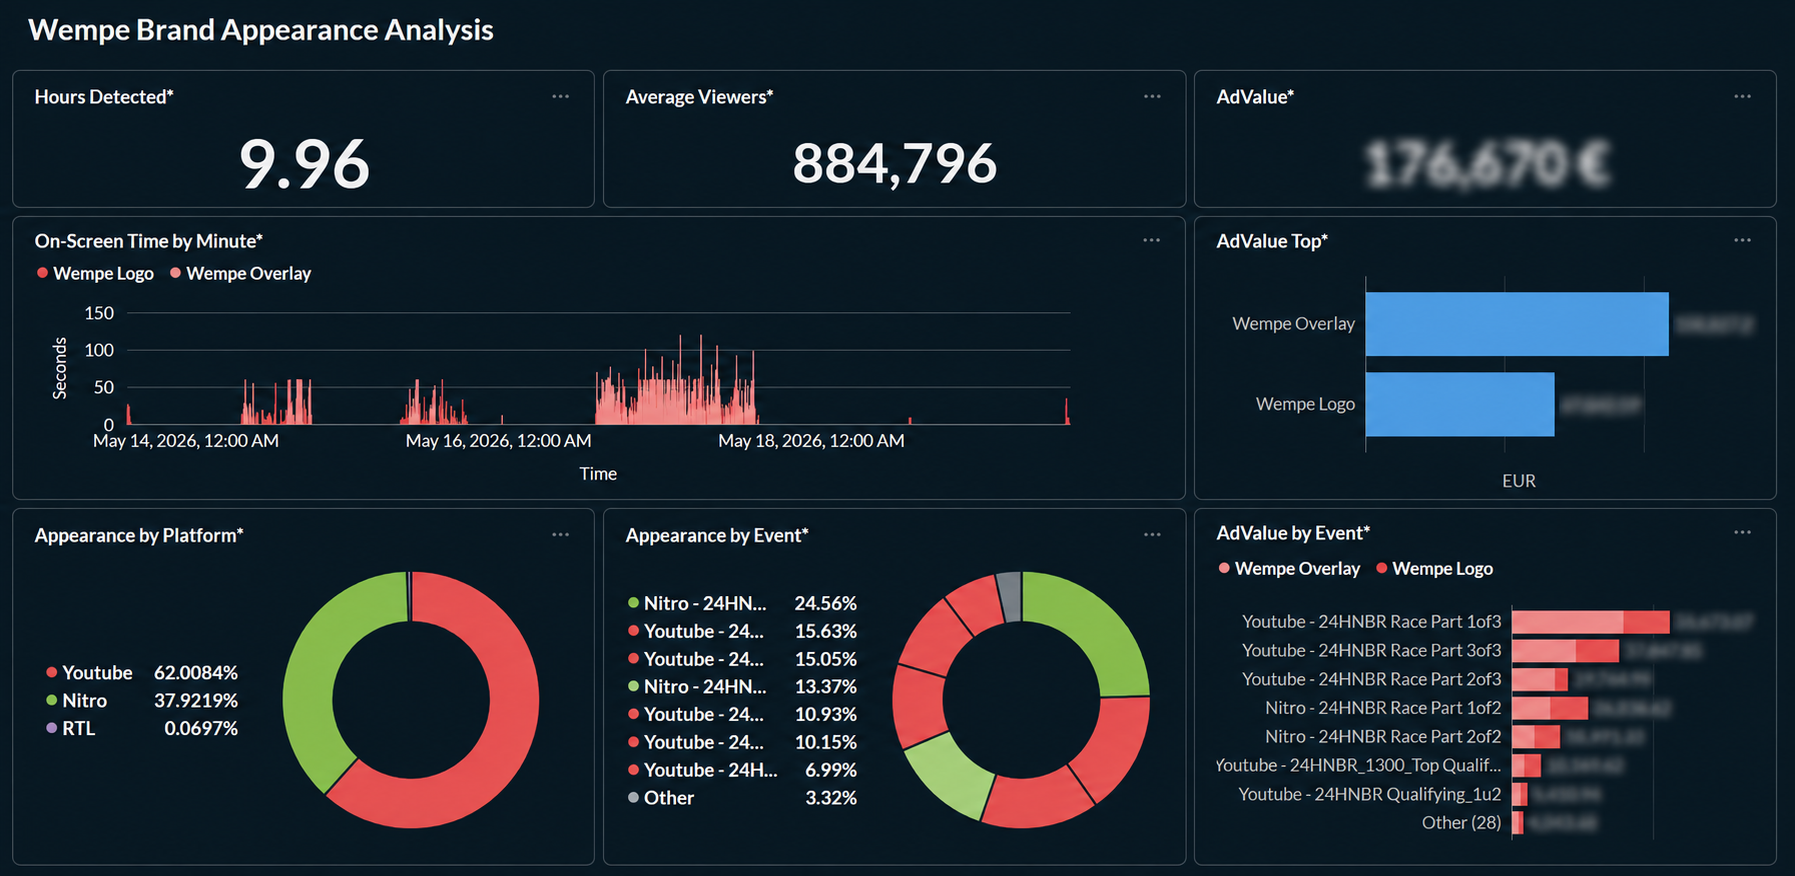
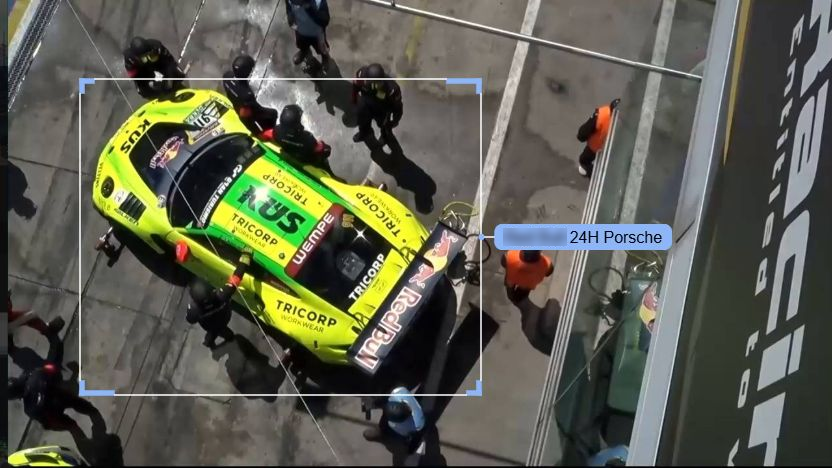
System screenshots from Panaccess analytics. Monetary figures in value dashboards are blurred.
Understand the measurement scope, the key findings and the placements contributing to your brand's exposure.
Compare selected brands, sources, events and time periods using a consistent set of measurement rules.
Review source frames, timestamps and placement details to understand what each finding represents.
This is a reporting outline, not a customer case study. The report format, fields and service level are confirmed for your project.
Start with your business question
One measurement workflow. Different questions for the teams investing in, delivering and reporting media exposure.
Brands & sponsors
Compare brand exposure across selected events, programmes and placements. See where products are shown, how they are used and how your presence compares.
For your next decisionCampaign planning, activation reviews and sponsorship discussions.
Sports & sponsorship →Clubs & rights holders
Connect jerseys, LED boards, court branding and interview walls with measured appearances. Build sponsor conversations around the evidence from agreed coverage.
For your next decisionPartner reporting, asset reviews and renewal conversations.
Explore sponsor measurement →Agencies & advisers
Use the same sources, dates and definitions to compare selected brands and campaigns. Combine a clear summary with evidence your clients can review.
For your next decisionClient reviews, competitor comparisons and campaign recommendations.
Brand & product placement →Broadcasters & media owners
Review selected advertising spots and branded content across agreed channels. Connect timing, source information and visual evidence for delivery reviews.
For your next decisionAdvertising verification, commercial reporting and media planning.
Advertising monitoring →Know what the numbers mean
Useful comparisons start with clear definitions. We agree the measurement rules and reporting scope before results are compared.
Occurrences of the selected brand or product in the monitored content.
The counting rules define when repeated detections belong to one continuous appearance and how replays or separate placements are treated.
How long a selected brand or product is visible within the agreed content.
Time is reported using the project's sampling and grouping rules. Treatment of simultaneous logos and overlapping placements is defined in the reporting scope.
Your measured exposure relative to the brands included in the comparison.
The denominator matters: the selected brands, sources, time window and measure must match. This is not a claim about every brand or all media.
Where and how a brand appears, from signage and apparel to a product in use.
Agree the placement categories, logo variants and relevant activities. Selected people and spoken mentions can be discussed as part of the project scope.
A summary measure to help interpret the brand's measured presence.
When a score is included, its scale, contributing inputs and interpretation need to be explained with the results. Compare scores only when their methodology matches.
Media Value captures the broader value of your brand's media presence. Advertising value (Ad Value) is one component of Media Value, calculated from visibility quality and duration.
We assess how clearly and prominently the brand appears and how long it remains visible. These measurements, together with the agreed valuation basis, determine the Ad Value contribution to the broader Media Value assessment.
Exposure is not the same as sales or ROI. Visibility is measured within the agreed content. Financial outcomes require separate evidence; media-value estimates are not sales revenue.
Sources, markets & availability
Panaccess can help source the content as well as analyze it. We confirm access, monitoring windows and reporting requirements for each project.
Check coverage for your market →Selected broadcast feeds, with availability confirmed by channel and territory.
Agreed platform or digital sources, subject to technical access and permitted use.
Existing footage and archives, subject to agreed file formats and measurement scope.
Local content access arranged with partners where the project requires it.
Live, historical and ongoing monitoring depend on source availability. Access to a source does not mean it is included in every monitoring package.
From source to sponsorship intelligence
A connected workflow from the agreed media sources to findings your team can review, compare and use.
Bring together the agreed TV feeds, streams and supplied footage. Confirm sources, territories, dates and access.
Defined content scopeIdentify selected logos, products and placements. Configure the target brands and variants relevant to the project.
Structured detectionsReview results according to the agreed service level. Enrich placement and context information where included.
Reviewed evidenceExplore results, compare exposure and share the findings through the agreed dashboards, reports or data delivery.
Decision-ready insightsClarify counting rules, variants and placement categories before measurement.
Confirm how uncertain detections and corrections will be handled.
Keep sources, periods and methodology consistent across comparisons.
Broadcast expertise behind the analytics
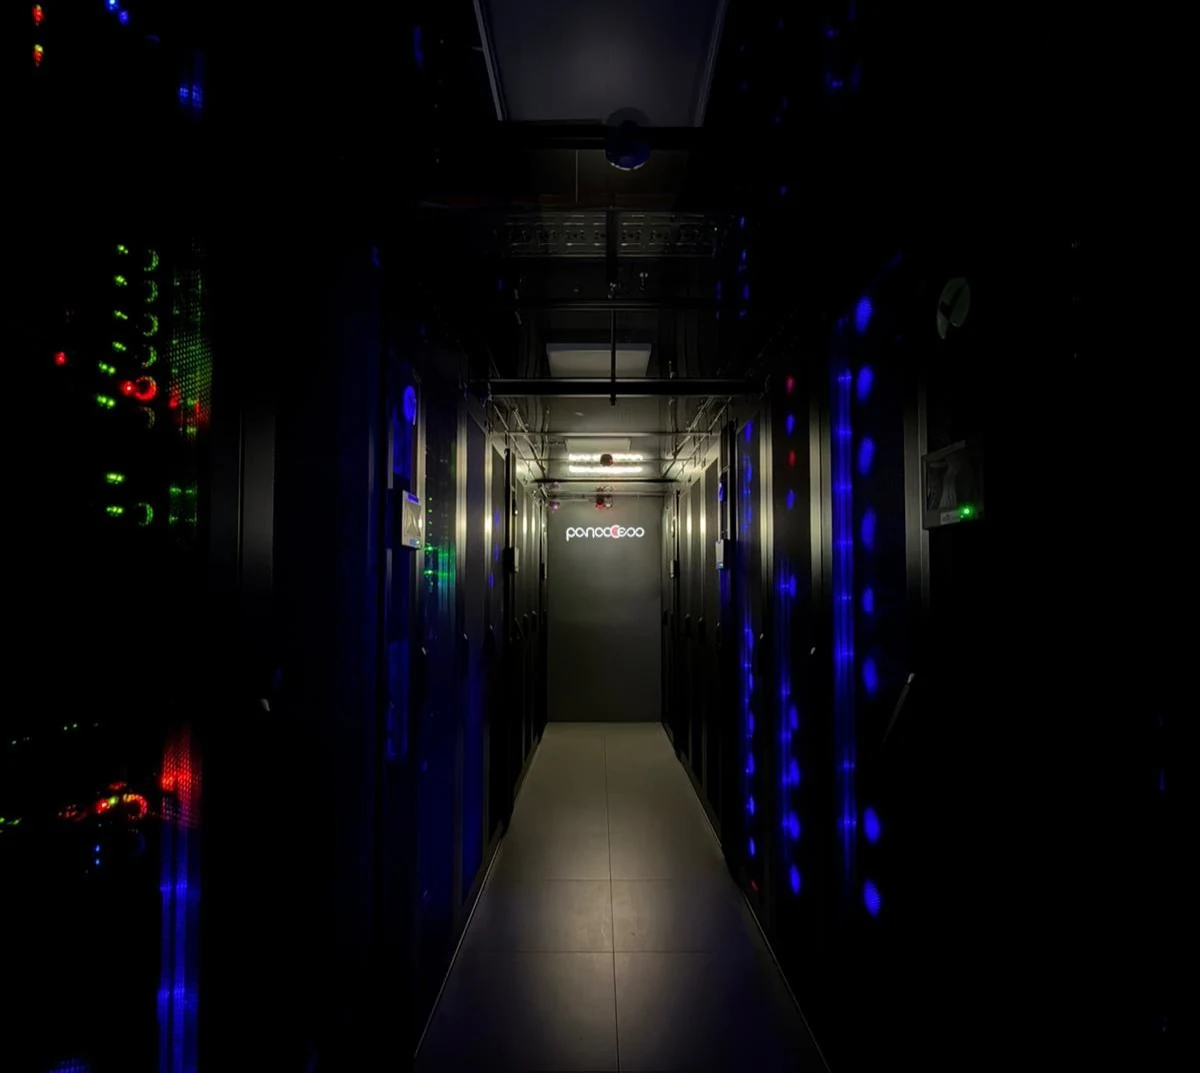
Panaccess brings signal acquisition, software development and media analytics together. Discuss the journey from receiving content to delivering evidence with a team that understands both.
Storage location, access permissions, retention and data delivery are agreed for the project.
Explore our Datacenter Service →Rialytiq is our sales and marketing partner for media analytics, helping brands, agencies and rights holders find the right solution.
Our partners →A project that fits your needs
Discuss the right scope for your question, whether you are reviewing a single campaign or planning a recurring measurement programme.
Explore a defined event, campaign or content collection with agreed targets and a focused results report.
Useful for an initial review or a clearly bounded measurement project.
Discuss a pilot →Discuss recurring measurement across agreed events and sources, with consistent benchmarks and reporting intervals.
Useful for tracking exposure and reviewing changes across a season.
Plan ongoing monitoring →Discuss tailored reporting, data exports or API handover to support your internal analysis and reporting processes.
Useful when your team needs to work directly with the agreed results.
Discuss data delivery →These are starting points for a conversation, not fixed packages. Sources, volume, target brands, review effort, delivery timing and pricing are confirmed before work begins.
Take the evidence further
Agree the export format and fields your team needs. Data handover can complement dashboards and reports, with API delivery discussed where appropriate.
Request a sample data structure →Illustrative field structure. Available fields, formats and integration arrangements are confirmed per project.
Before you get started
Have a specific source, sport or market in mind? Start with a direct conversation.
Contact Panaccess →Yes, supplied footage can form part of a measurement project. We first confirm the file formats, content access, recording quality, dates and targets to be analyzed.
We can discuss direct signal acquisition and partner-based access. Tell us the channels, platforms, territories and monitoring period so that availability and permitted use can be checked.
Share the target brands, logo variants and examples of the content. We will review the detection requirements and agree the supported targets and configuration before measurement begins.
Turnaround depends on the content volume, source availability, processing and agreed review level. We confirm monitoring frequency, review requirements and delivery dates with you before the project starts.
Media Value is the broader assessment of your brand's media presence. Ad Value is the advertising component within it, based on visibility quality and duration. This takes into account how clearly and prominently a brand appears and how long it is visible. We agree the data sources and valuation basis for each project.
Panaccess operates its own datacenter in Ismaning, Germany. Storage location, access permissions, retention and any project-specific partner arrangements are confirmed for your service.
Yes. Tell us the question you want to answer, the target brands and the available footage. We can discuss a focused initial scope and the deliverables needed to evaluate the approach. Availability and commercial terms are agreed in advance.
Let's define the right measurement
Start with your brand, your content and the decision you need to make.