

Media Analytics guide
How sponsorship visibility is measured
A sponsor logo can appear on a shirt, a trackside board or an interview wall. Measuring that presence starts with the footage: where the brand appears, how long it stays on screen and how clearly it can be seen.
Start with the coverage you want to understand
A useful sponsorship report has a defined scope. Choose the competitions, programmes, channels, markets and dates to be included. Decide whether the analysis covers the live event only or also replays, highlights, interviews and selected digital coverage.
The same applies to the targets. Agree which sponsor logos, product variants and placements should be recognised. A result for a shirt logo answers a different question from a result for a whole vehicle or a TV overlay. Keeping those categories clear makes the report easier to use.
Panaccess combines AI recognition with human review within the agreed service scope. Our sports and sponsorship analysis connects detected appearances with their placement and duration.
What the main measures tell you
- Brand appearances
- The occurrences of a selected brand or product in the monitored content. Counting rules define when successive detections form one continuous appearance and how replays or separate placements are treated.
- On-screen time
- How long the selected brand or product remains visible. The project rules determine how sampling, simultaneous logos and overlapping placements contribute to the time measurement.
- Placement and context
- Where and how the brand appears: for example, on clothing, pitchside signage, an interview backdrop or a product in use. These categories help explain what produced the measured presence.
- Share of visibility
- The brand's measured presence relative to the brands included in the comparison. It is meaningful only when the same sources, period and measure are used.
Illustrative example
The same duration can look very different
Imagine two ten-second appearances. In one, a sponsor logo is clear and prominent on an interview wall. In the other, the logo is partly hidden on a moving shirt. Both contribute to on-screen time, but the quality of their visibility differs. Duration and visibility quality should therefore be read together.
This is an explanation of the measures, not a customer result or a valuation formula.
Keep the original images behind the figures
A summary is more useful when your team can review the footage behind it. Source frames and timestamps help show which brand was recognised and which placement was recorded.
Human review and agreed counting rules matter here. Uncertain detections, corrections and the way appearances are grouped should follow the method set for the project. The report should explain the scope of that review rather than leave it to assumption.
For appearances in entertainment and other programmes, brand and product-placement monitoring applies the same need for clear placement categories and supporting evidence.
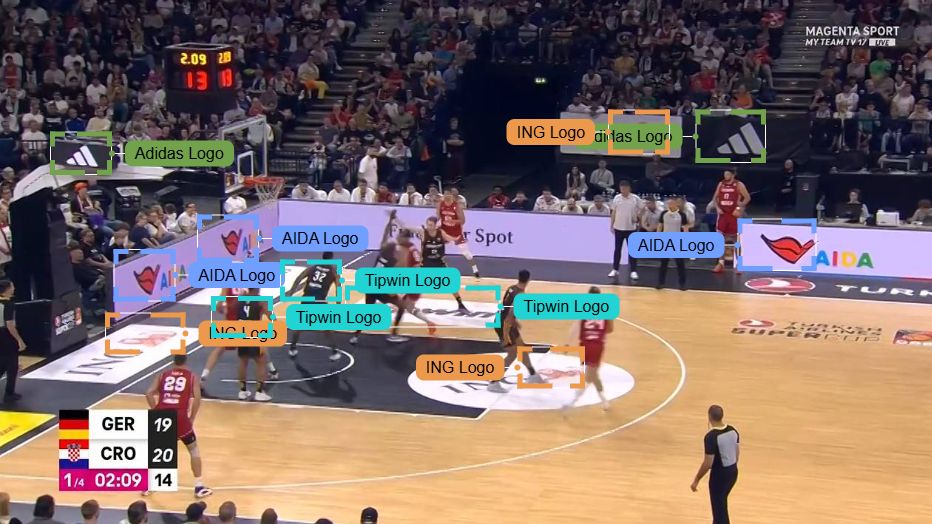
Compare like with like
Before comparing two sponsors, events or periods, check that the underlying scope matches. A live broadcast and a collection of short highlights are different bodies of material. A change in coverage can change the figures even when the sponsor placement itself is unchanged.
- Use the same definition of an appearance and the same time-measurement rules.
- Keep sources, dates and the set of comparison brands consistent.
- Separate placement types when they answer different questions.
- Explain any missing sources or changes in the reporting scope.
- Add audience contacts only when suitable audience data and an agreed method are available.
Visibility is not a direct measure of sales or ROI. It documents brand presence in the analysed content. Revenue effects require additional data and analysis.
If you also need a valuation, see how Media Value and Ad Value relate. Ad Value is one component of Media Value and depends on the quality and duration of visibility.
Planning a sponsorship measurement project?
Tell us which brands, competitions and markets you want to examine. We can discuss the available sources, counting rules and reports.
Discuss your analysis