

Use cases
Practical system example
24H Nürburgring: cars, logos and broadcast overlays.
A race car, a trackside logo and a TV overlay are different types of exposure. These Nürburgring screenshots show how Panaccess identifies them separately and keeps each detection connected to the source footage.
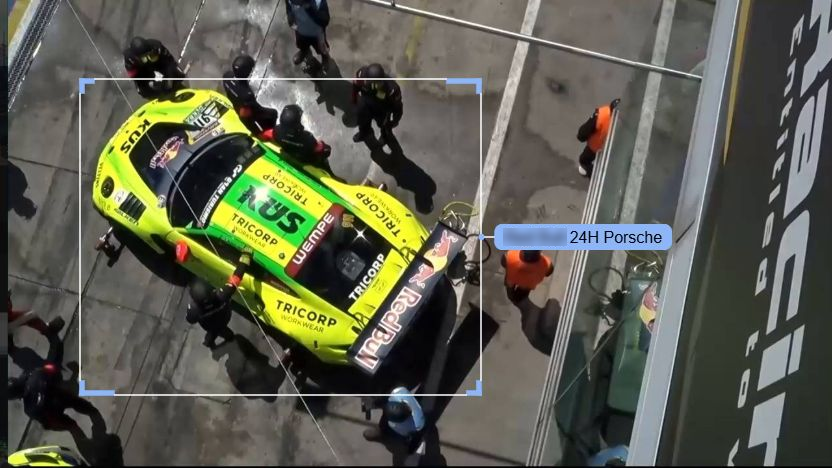
What exactly appeared on screen?
For a sponsorship review, the first question is what should be measured: a particular vehicle, an individual logo or a sponsor overlay added to the broadcast. The examples below distinguish these targets. A whole-car detection does not mean that every logo on the car has also been detected individually.
From race footage to a sponsorship report
Define the coverage
Set the competitions, territories, sources and reporting period. Specify the vehicles, brands and placement types to be analysed.
Detect distinct targets
Identify configured vehicles, logos and broadcast overlays. Keep those target types separate when reviewing exposure.
Review the evidence
Use source frames and timestamps to check where a target appears. Additional validation and context follow the project’s service level.
Report the exposure
Review appearances and on-screen time, with event, placement or platform breakdowns where included in the project.
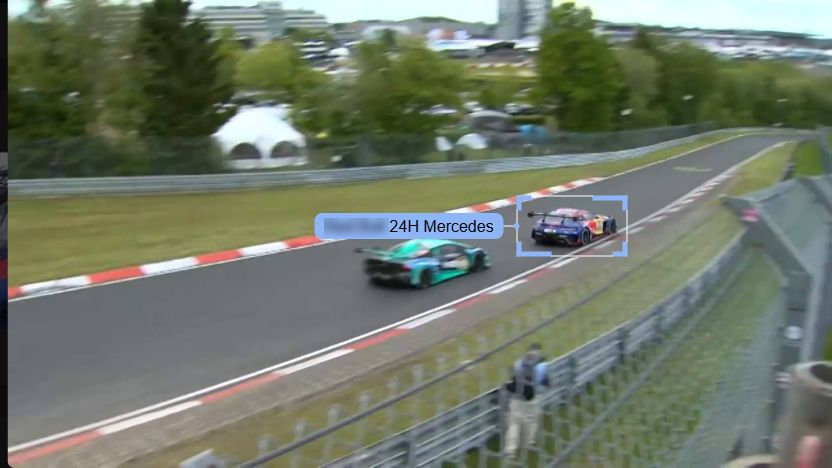
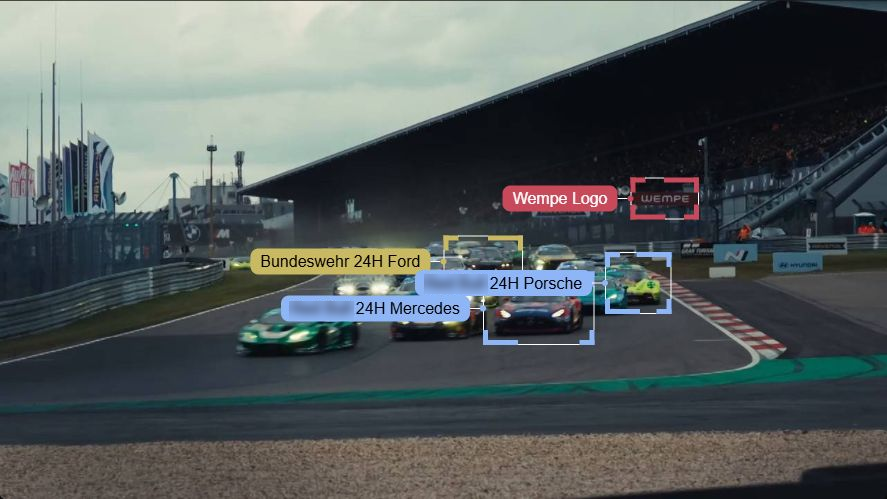
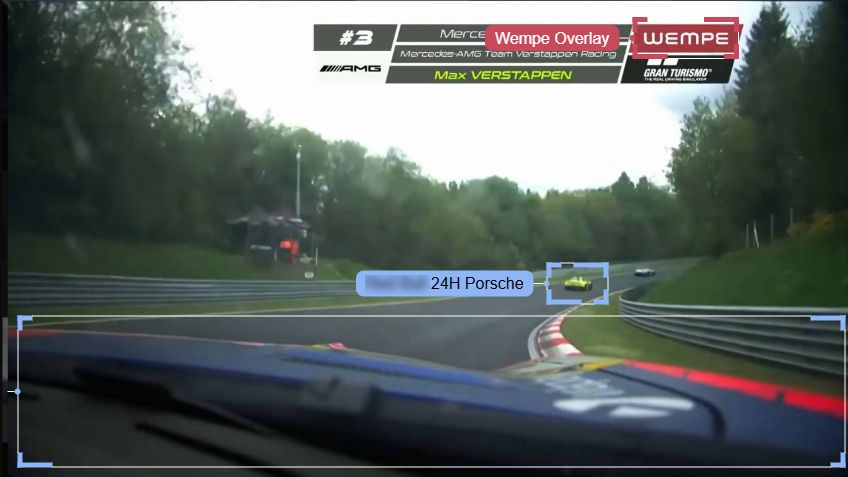
Different targets within the same broadcast
These examples cover a car on track, several vehicles in one shot, trackside signage and an overlay in the TV picture. They illustrate the detection categories; they are not a ranking of sponsorship performance.
Keep detection evidence and valuation distinct
The reporting view brings together on-screen time and exposure breakdowns. Audience figures and monetary valuation require the relevant data and methodology to be included in the project. Media Value covers the broader media exposure; Ad Value is its advertising-related component, weighted by visibility quality and duration.
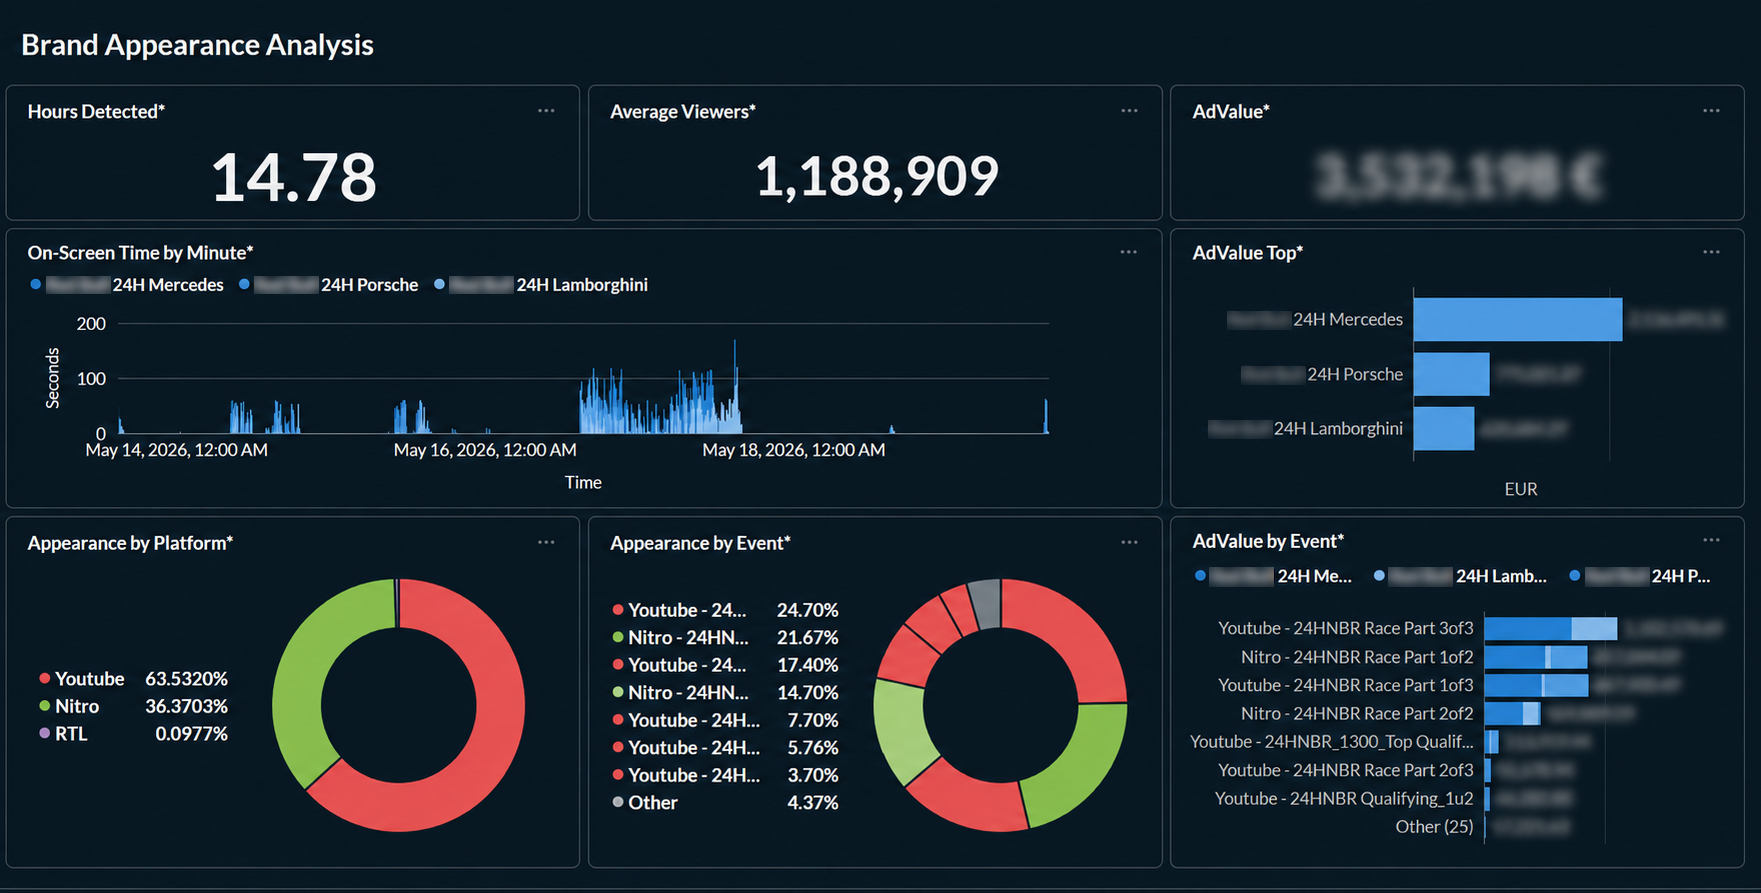
These are practical examples from the Panaccess analytics system. The organisations and brands shown are not presented as customers or as endorsing Panaccess.
Practical system example
Product placement in context.
A product in a fridge plays a different role from a can held by a character. Panaccess connects product and logo detections with the scene, the placement and the activity shown, then makes those categories available for comparison.
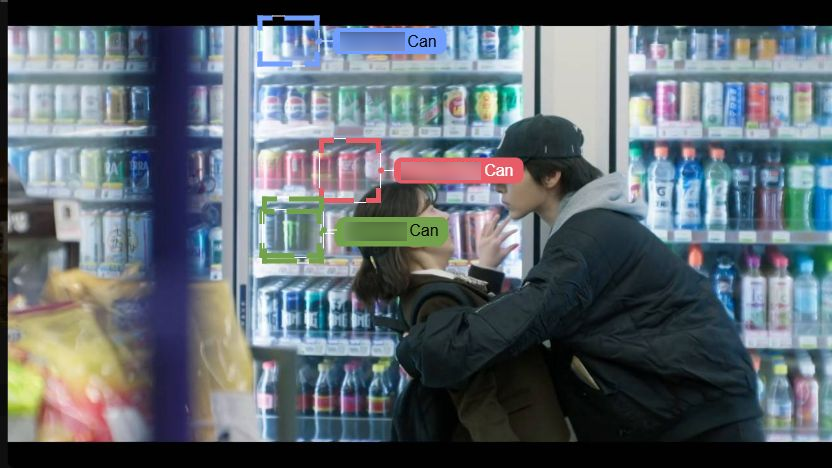
Where does the product fit into the scene?
A useful placement analysis looks beyond the presence of a logo. Is the product on a table, in a fridge, held in a hand or being used? What is happening around it? These examples show how source detections and context categories can support a comparison across the content being analysed.
From a scene to a comparable report
Define the comparison
Set the content, territories and period to analyse. Specify the target brands, competitors and context categories relevant to the question.
Identify appearances
Detect the configured products and logos. Keep a connection to the source scene so appearances can be reviewed.
Classify the context
Review placement and activity categories, such as a product in a fridge, a can in hand or a social occasion, where included in the analysis.
Compare the findings
Compare brands within the same content and reporting period, using the placement, occasion and on-screen-time views available for the project.
A placement is more than a product count
The frame below shows products held by people. It can be reviewed alongside background placements such as the fridge example. Detection boxes make the system’s targets visible; scene context explains how those targets appear.
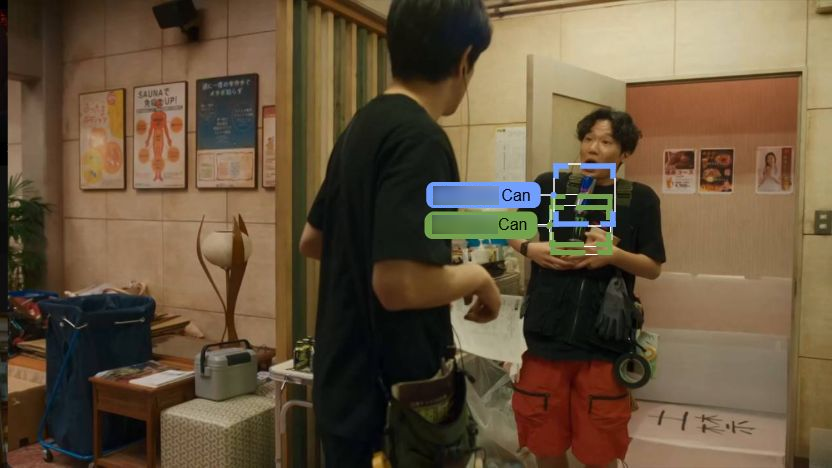
Compare placement and occasion categories
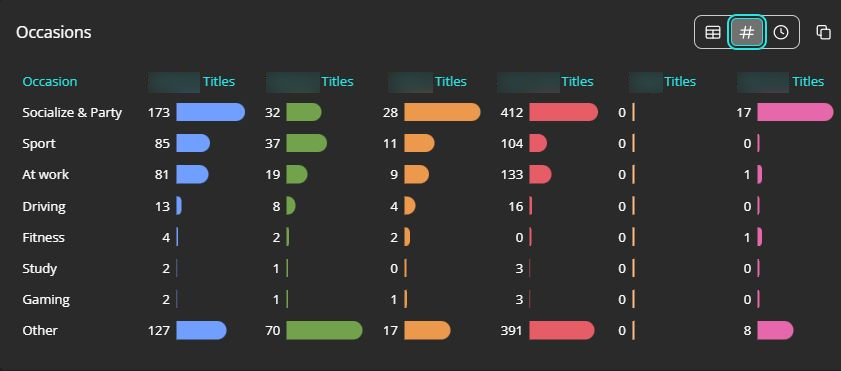
The placement view groups detected appearances by categories such as “On Table”, “Fridge” and “Can in Hand”. The occasion view adds contexts such as sport, work and social situations. In these example views, the selected count is the number of titles with a detected brand presence in each category; it is not a measure of sales or purchase intent.
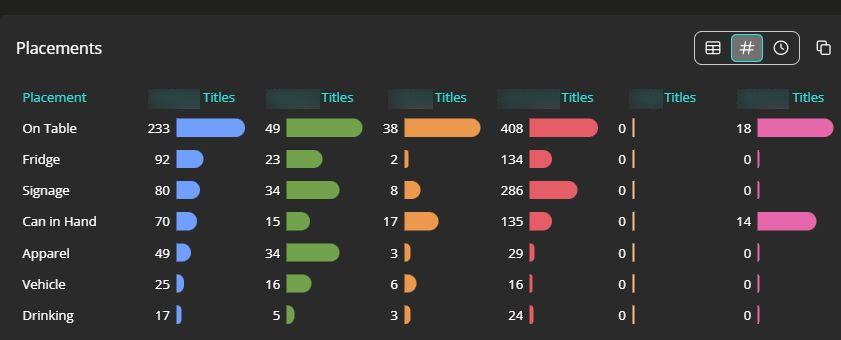
Read the results within their coverage
A comparison applies to the sources, titles and period included in the analysis. Source access, validation, context enrichment and reporting are defined for the project. An appearance or a long on-screen duration does not by itself demonstrate attention, preference or commercial impact.
These screenshots illustrate the Panaccess analytics workflow. They do not identify a commissioning customer or imply endorsement by the programmes or brands shown.